
SBI Funds Management IPO: A Passive Compounder?
It commands the largest asset base in India, yet has lower profit than its peer. We breakdown the realities behind the country’s biggest asset manager.

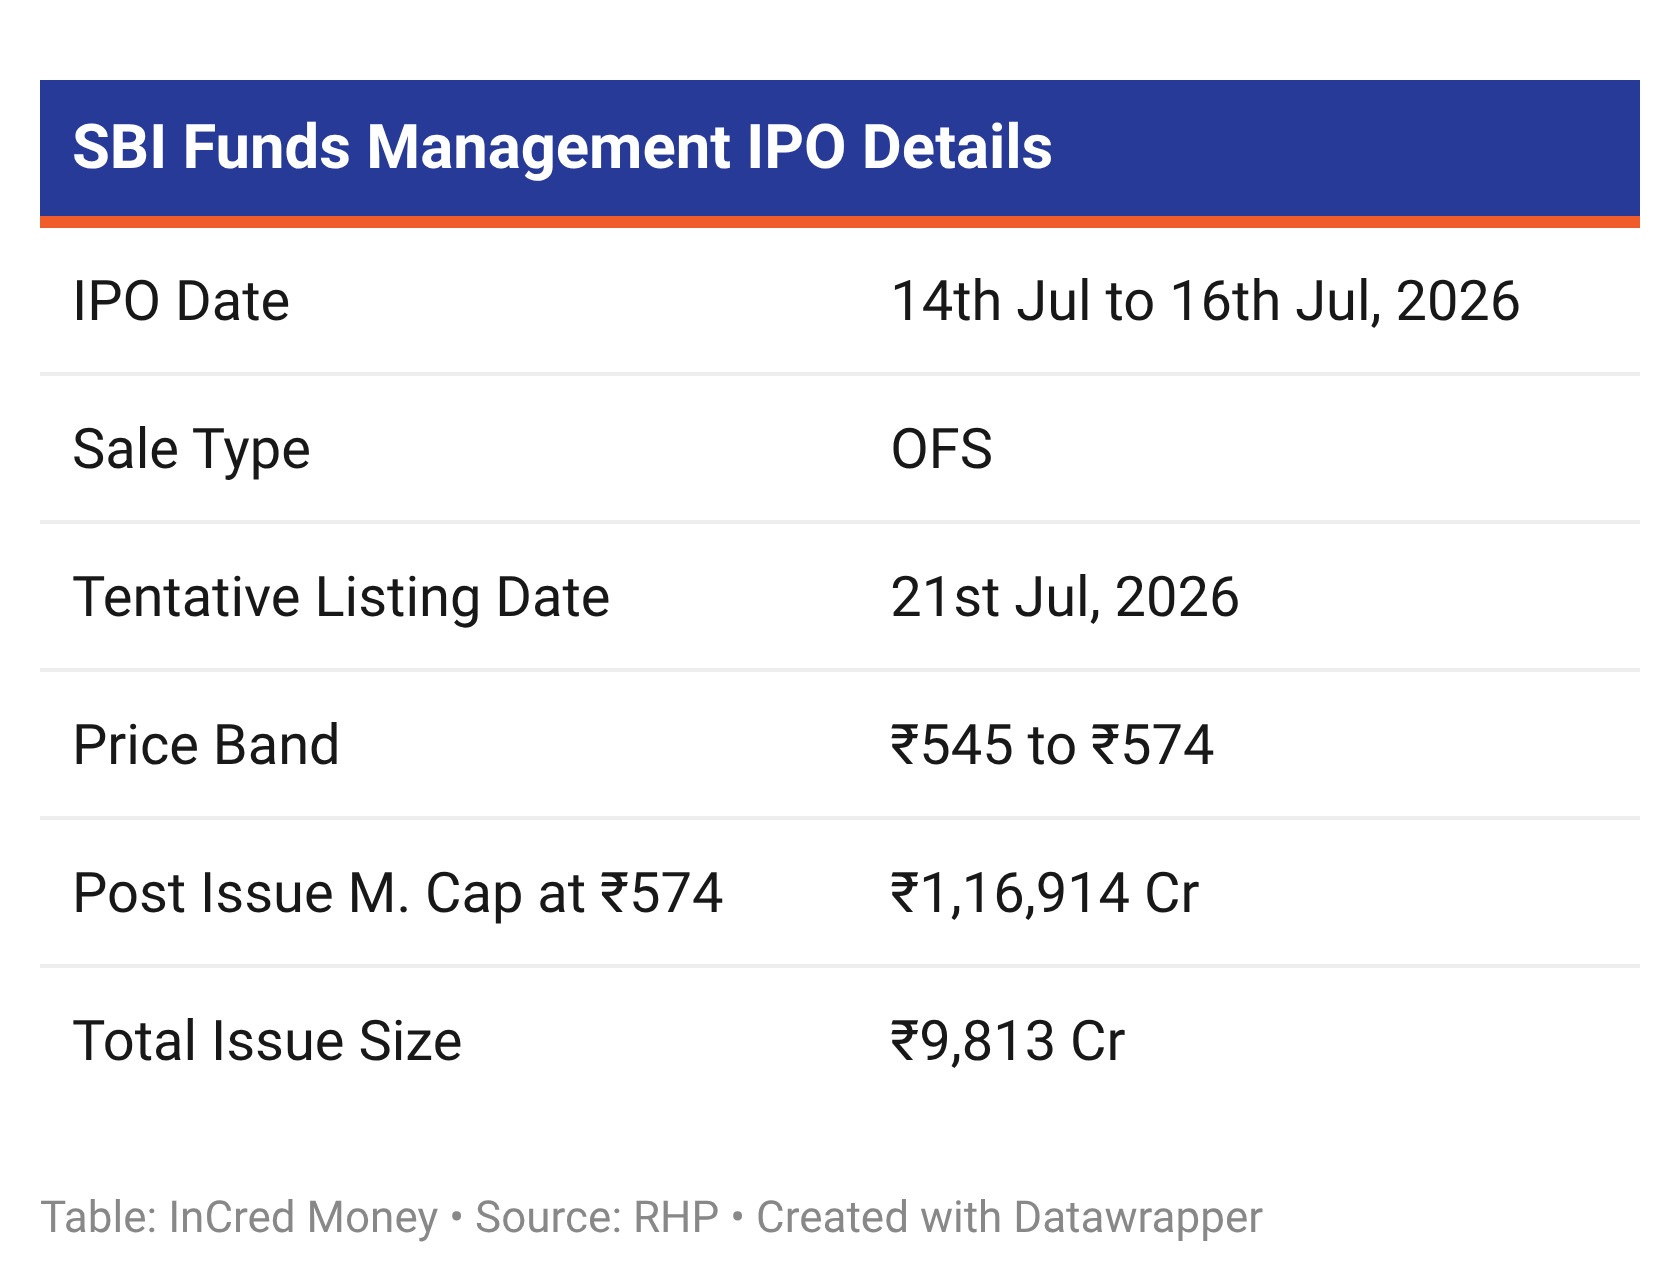
SBI Funds Management Limited (SBI Mutual Fund) is filing a ₹9,813 Cr IPO on 14th July, 2026, entirely an offer for sale by SBI and Amundi India Holding. SBI Mutual Fund has run continuously since June 1987, making it India’s oldest mutual fund, and it controls ~15.3% of India’s mutual fund industry by AUM, a position it has held since March 2021.
IPO Overview
The Big Picture
The Indian mutual fund industry has grown from ₹ 32,10,540 Cr in quarterly average assets under management (QAAUM) in FY21 to ₹ 81,53,970 Cr in FY26, a compound annual growth rate of 20.5%.
Despite this growth, mutual fund penetration in India remains low. The industry had approximately 61.4 million unique investors as of FY26, close to 4% of India’s population. Financial literacy is also limited, with only 27% of the population classified as financially literate as per the National Financial Literacy and Inclusion Survey, 2019.
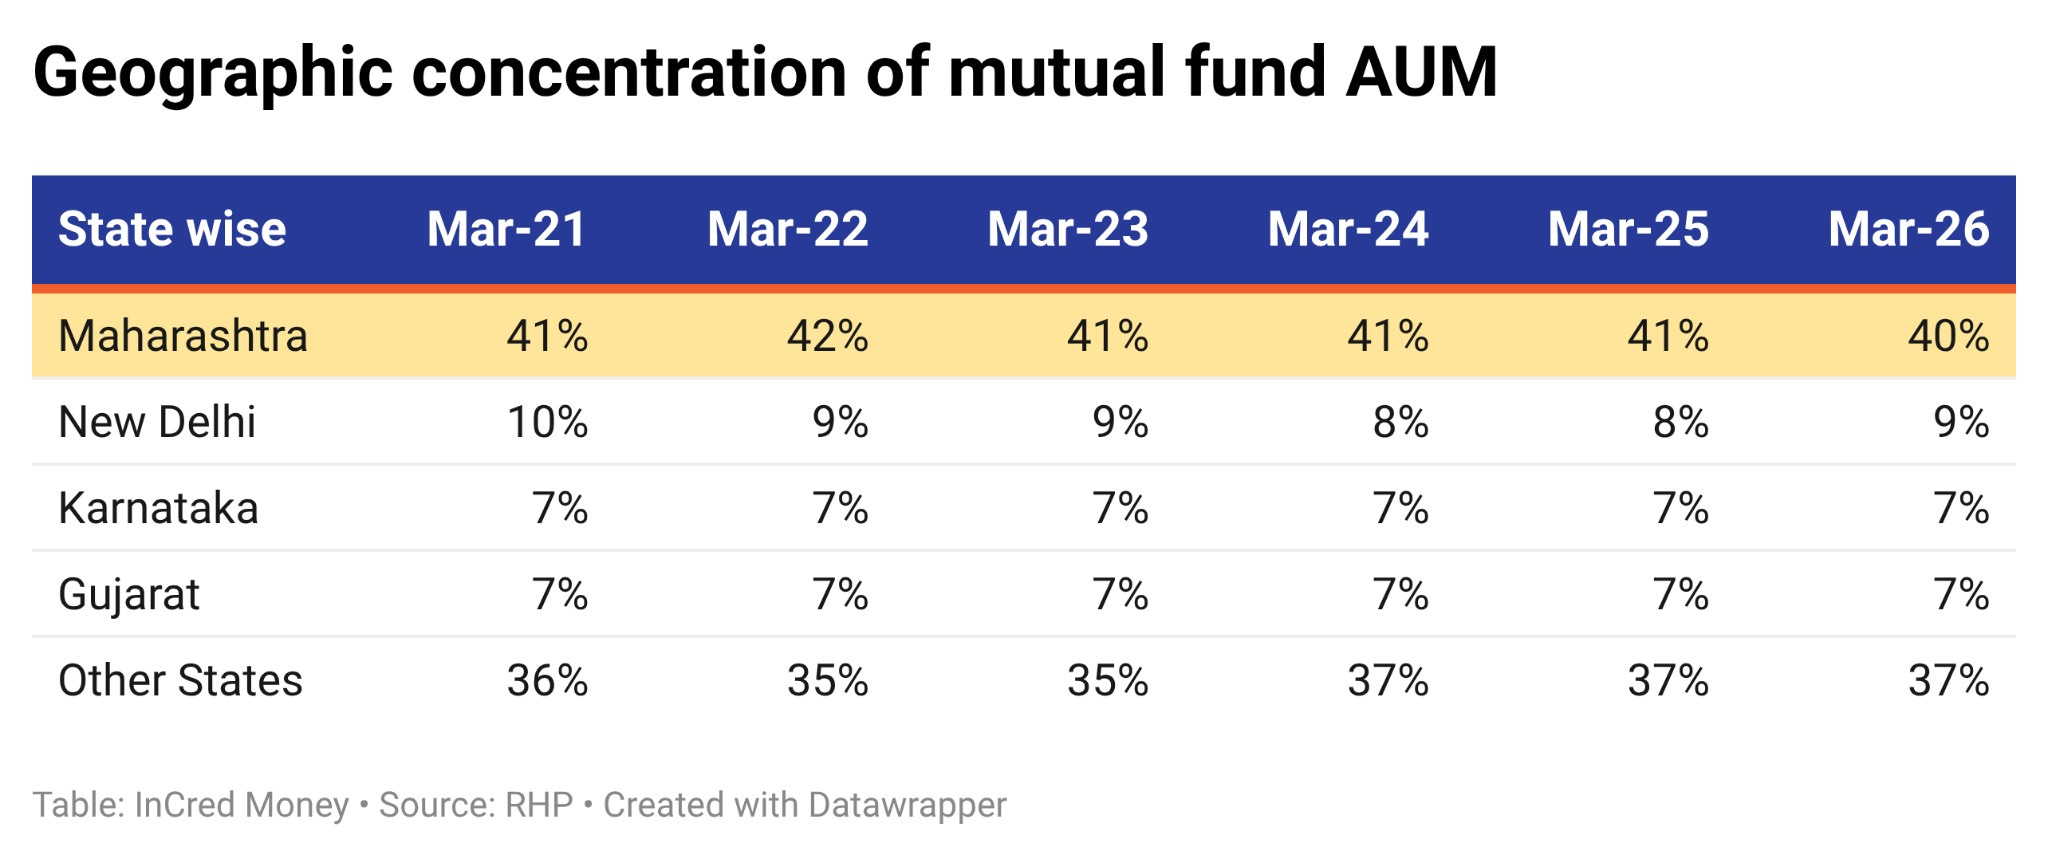
The industry also remains geographically concentrated. Maharashtra alone accounted for 40.1% of total mutual fund assets under management as of FY26, and the top five states together accounted for 67.5% of the total.
Factors supporting industry growth are:
Rising household incomes
Government initiatives to expand financial inclusion
Growing demat account penetration and a shift of household savings away from physical assets such as gold and real estate towards market-linked instruments.
(Source: RHP)
For ABCs on all upcoming IPOs, subscribe to IPOs with InCred Money
Continue reading!
Business Model
According to the RHP, SBI Funds Management Limited is the largest asset management company in India by quarterly average assets under management for mutual funds, with a market share of 15.3% as of March 31, 2026. It has held this position since March 2021.
The company’s promoters are State Bank of India, Amundi India Holding and Amundi Asset Management.
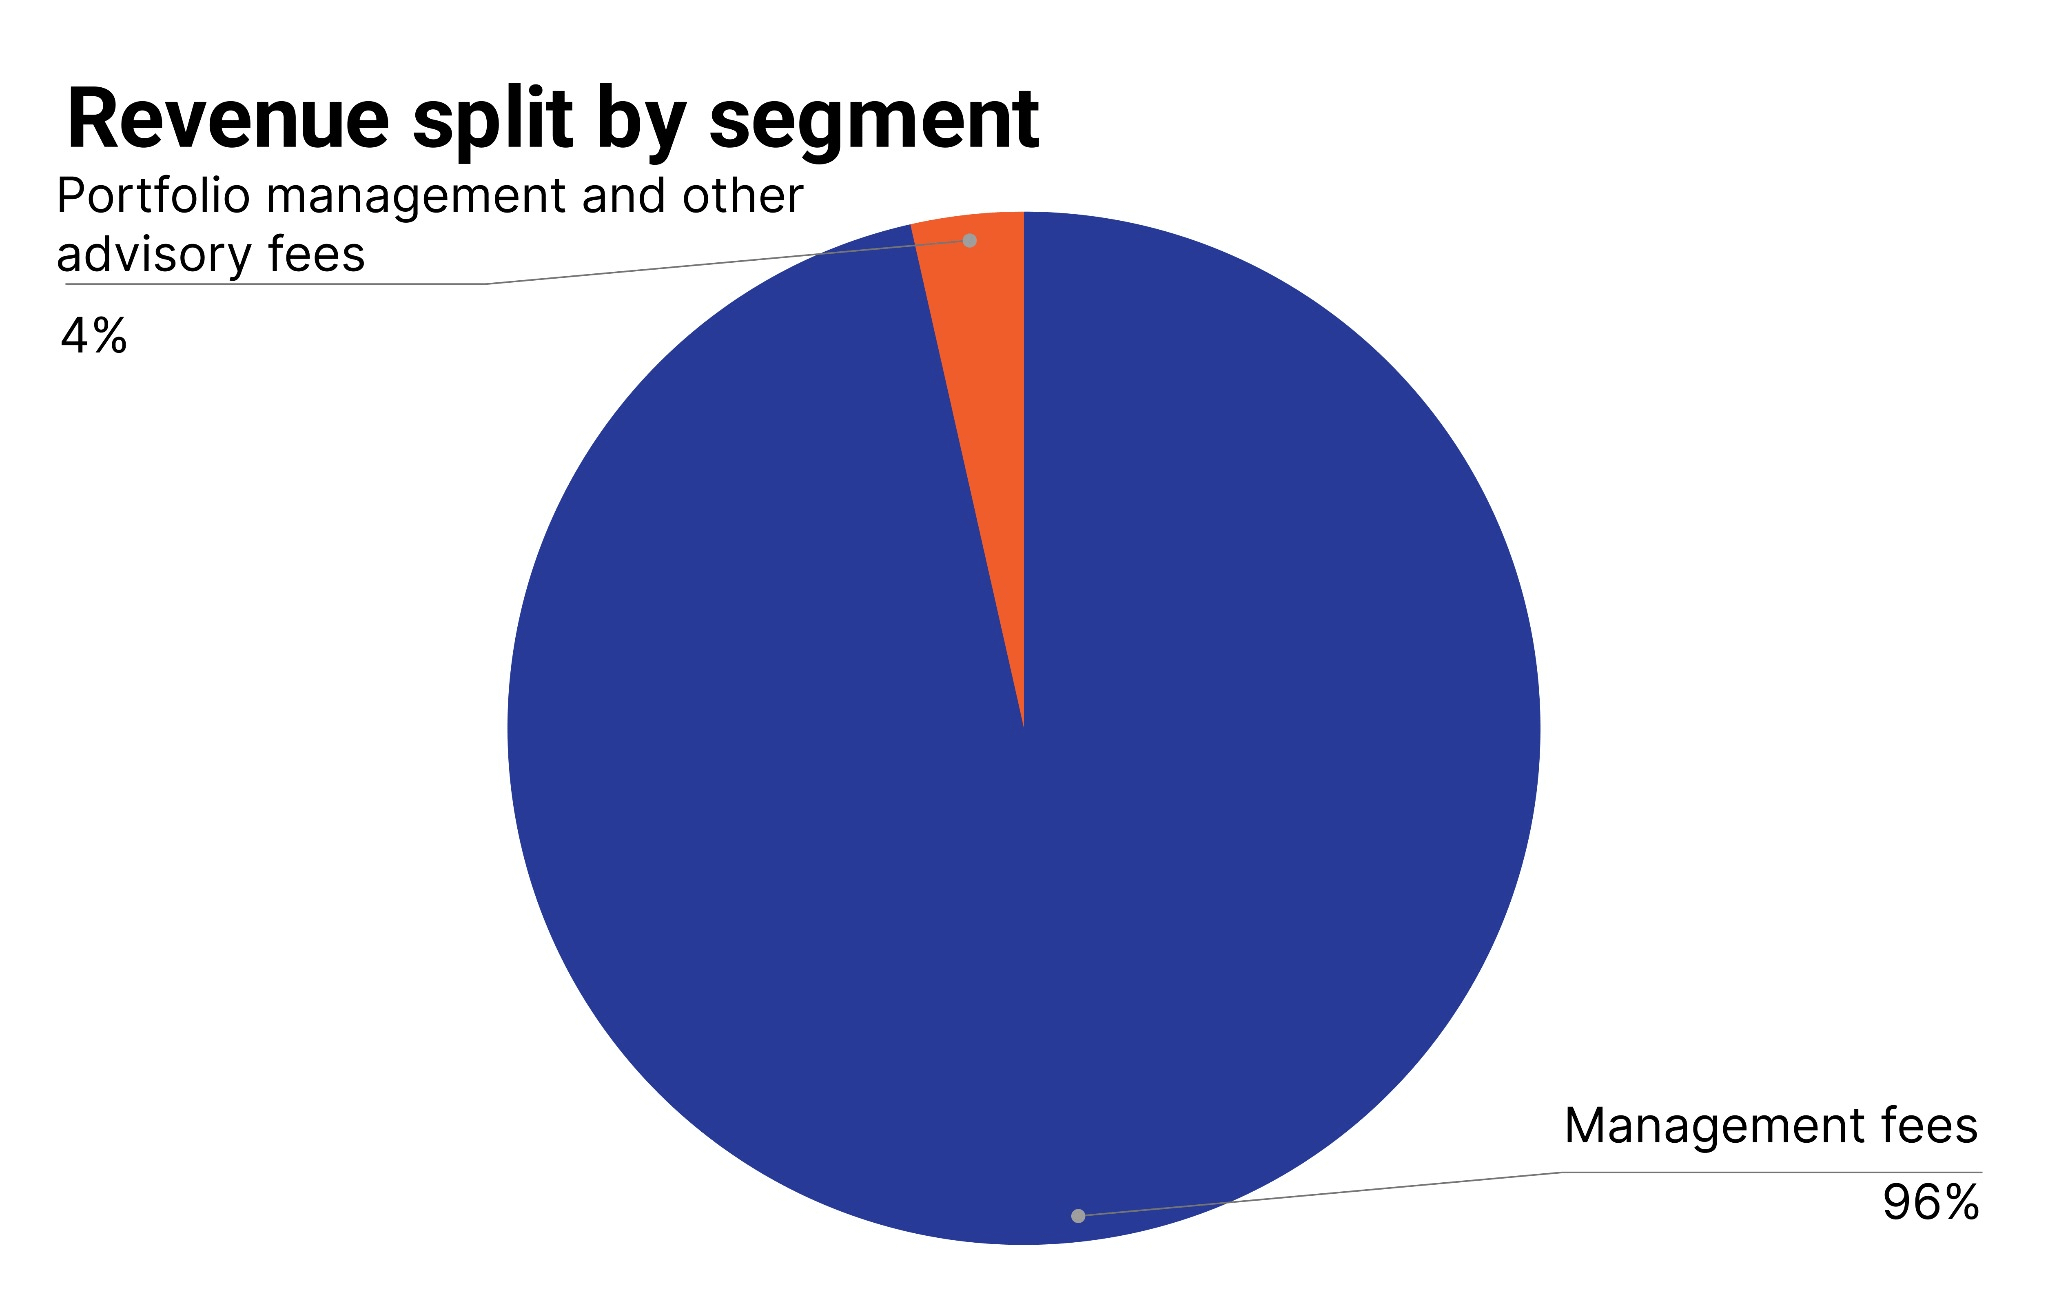
The company earns management fees as investment manager to the mutual fund schemes it runs. Management fees made up 96% of the company’s revenue from operations in FY26..
The fee a scheme can charge is capped by SEBI through the Total Expense Ratio, and this varies by scheme type (Active, Passive). Because equity-oriented schemes carry the highest fees, the company’s overall fee realisation and margin depend heavily on the equity share of its asset mix.
The company also earns through other services like:
1. Portfolio Management Services (PMS) and Advisory
According to the RHP, it is the largest PMS and advisory business in India by AUM, with a market share of 39.7% as of March 31, 2026. A large part of this book comes from managing a portion of a statutory provident fund institution’s equity investments.
2. Alternative Investment Fund (AIF)
The company is the sponsor and investment manager of the Corporate Debt Market Development Fund, an alternative investment fund set up to support liquidity in India’s corporate bond market.
3. Specialized Investment Fund (SIF)
This is the company’s newest platform. Its Magnum SIF product held a 28.2% share of the SIF segment as of March 2026, the largest in that segment.
The Financial stuff from Revenue to PAT
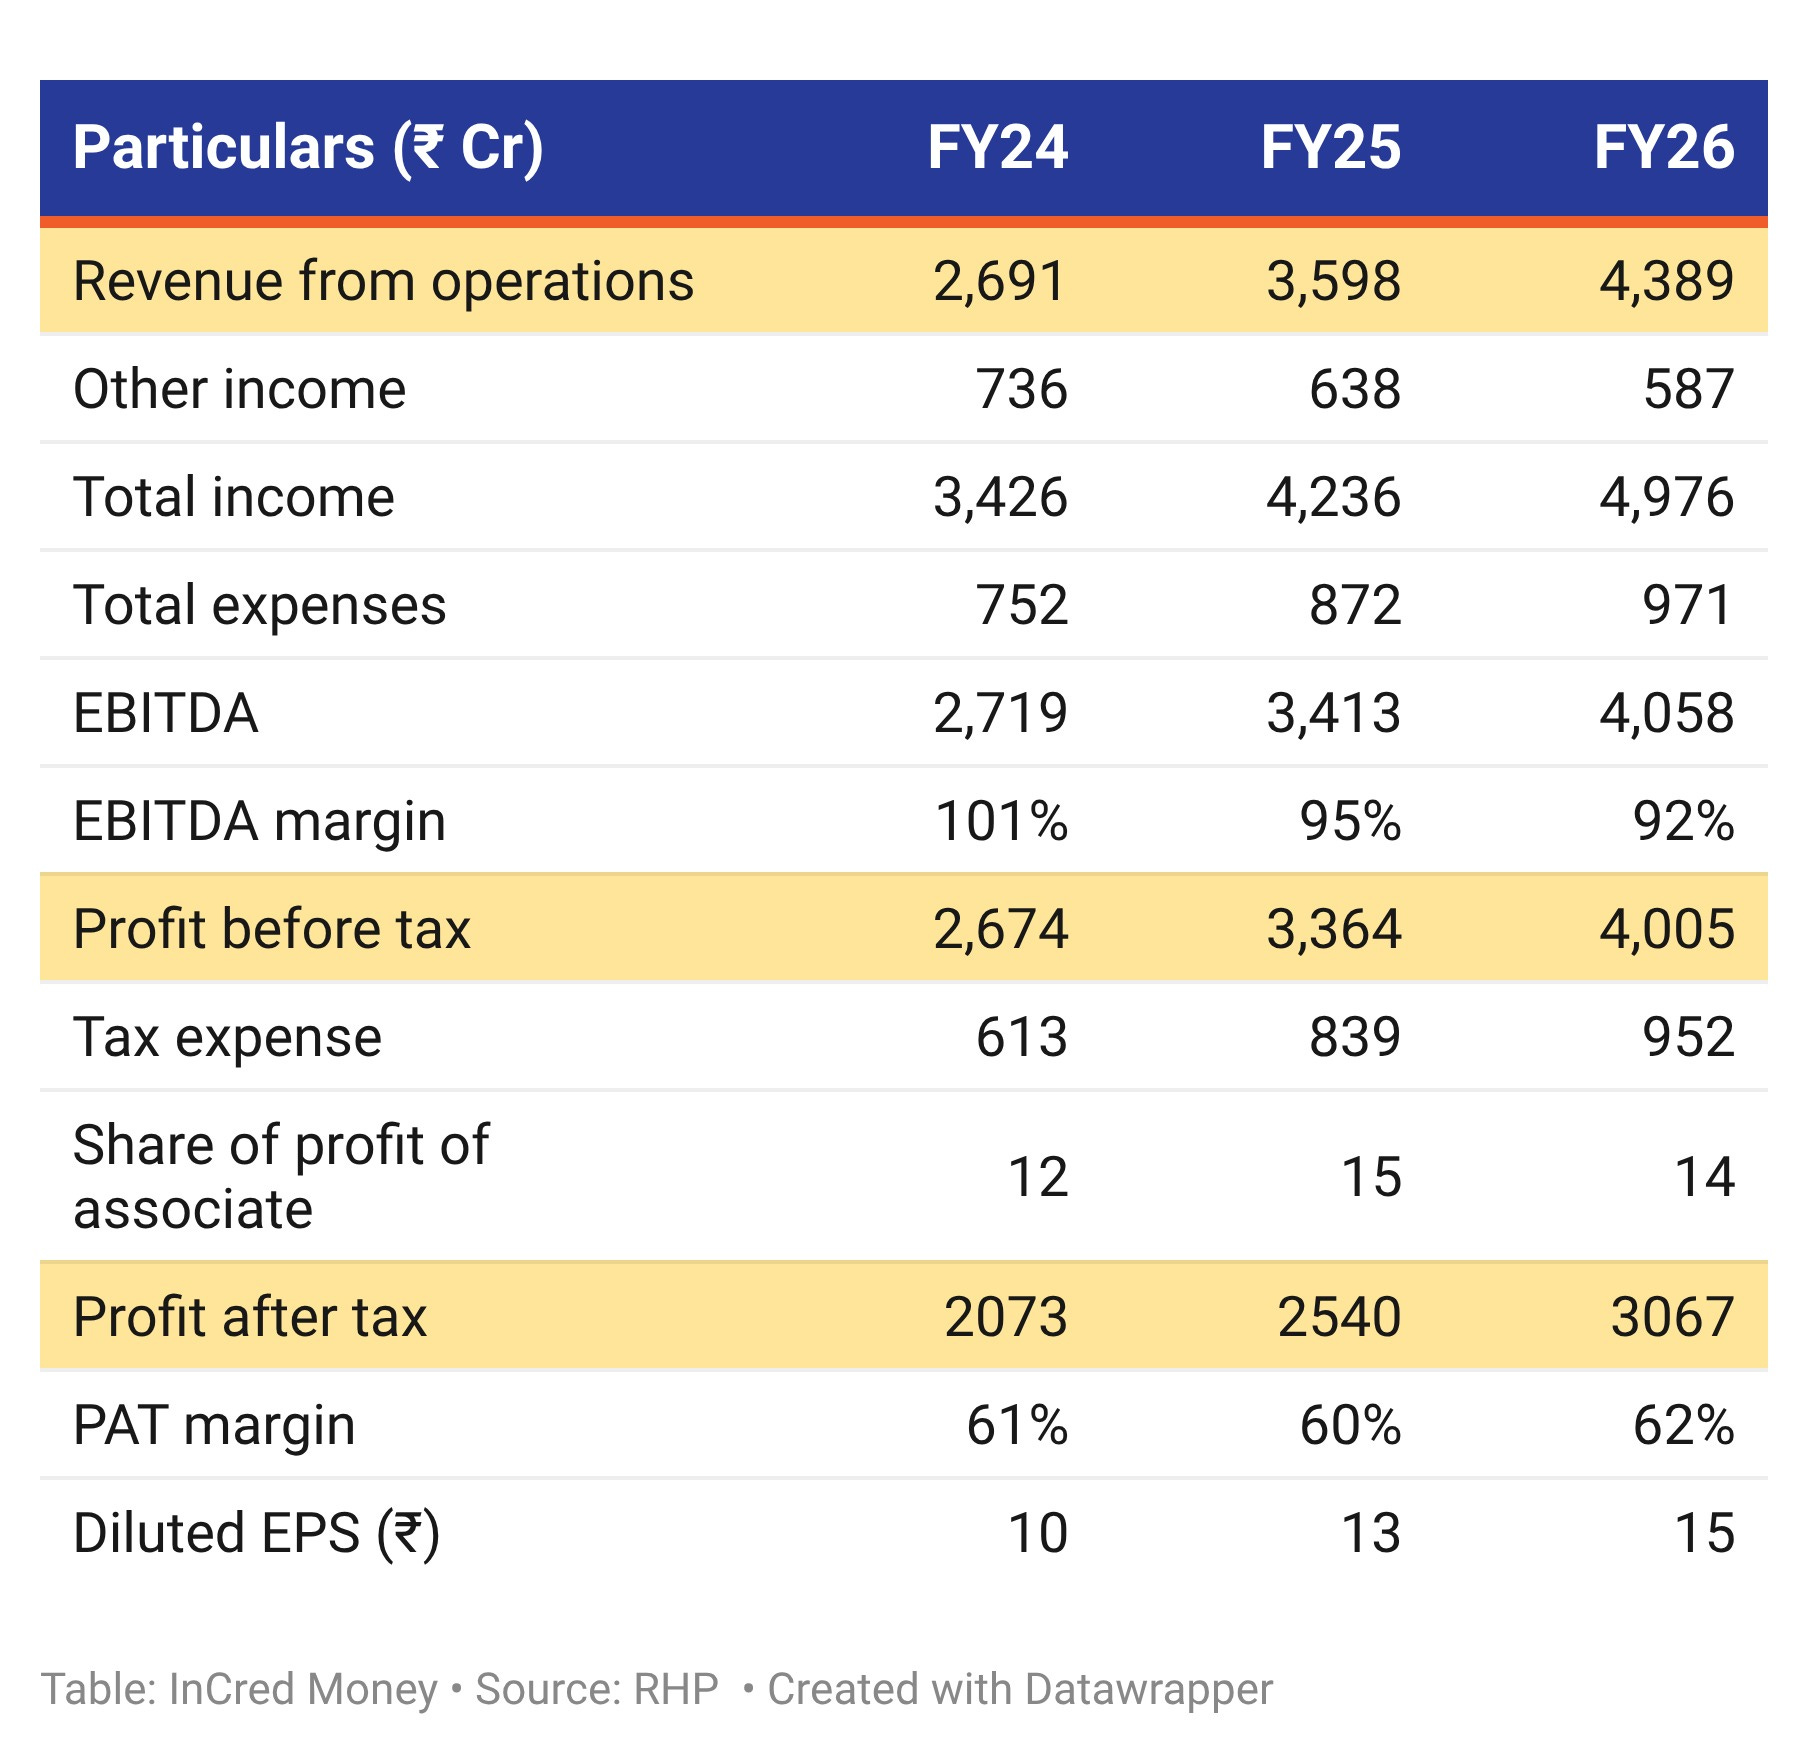
Revenue from operations grew at a compound annual growth rate of 28% between FY24 and FY26, driven by growth in asset management fees.
Profit after tax grew at a compound annual growth rate of 22% over the same period, and the PAT margin on total income expanded from 61% to 62%.
Return on equity stood at 43% in FY26, up from 34% in FY25.
Operating Metrics
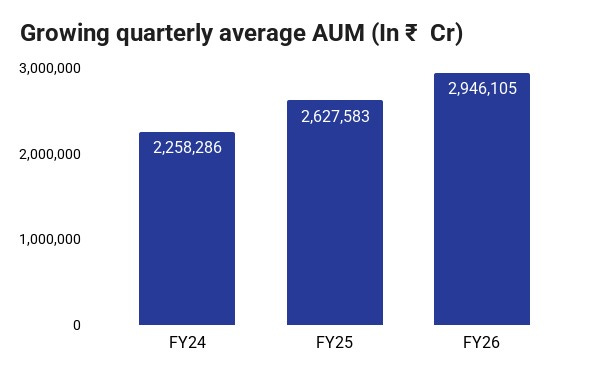
Assets Under Management by Category: AUM has been increasing steadily from FY24 to reach ₹ 2,946,105 Cr in FY26 growing at a CAGR 9% from FY24-FY26.
(Source: RHP)
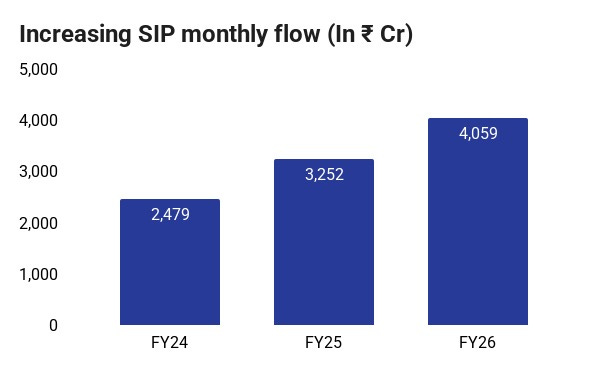
Monthly SIP flow: Monthly SIP flow, increased from ₹2,479 Cr in FY24 to ₹4,059 Cr in FY26.
(Source: RHP)
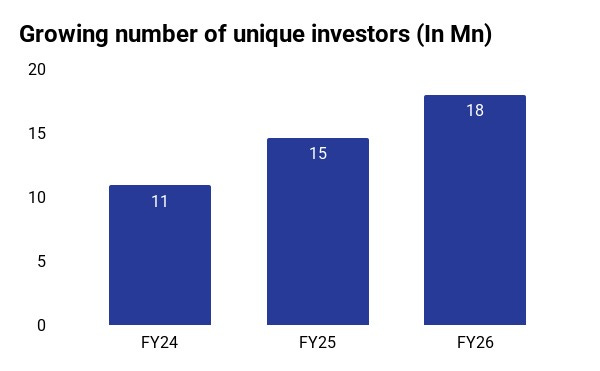
Growing unique investors: Company has been steadily increasing its investor base by adding new unique investors. The company had 18 Mn unique investors in FY26 growing at a CAGR of 17% from FY24-FY26
(Source: RHP)
Peer Data
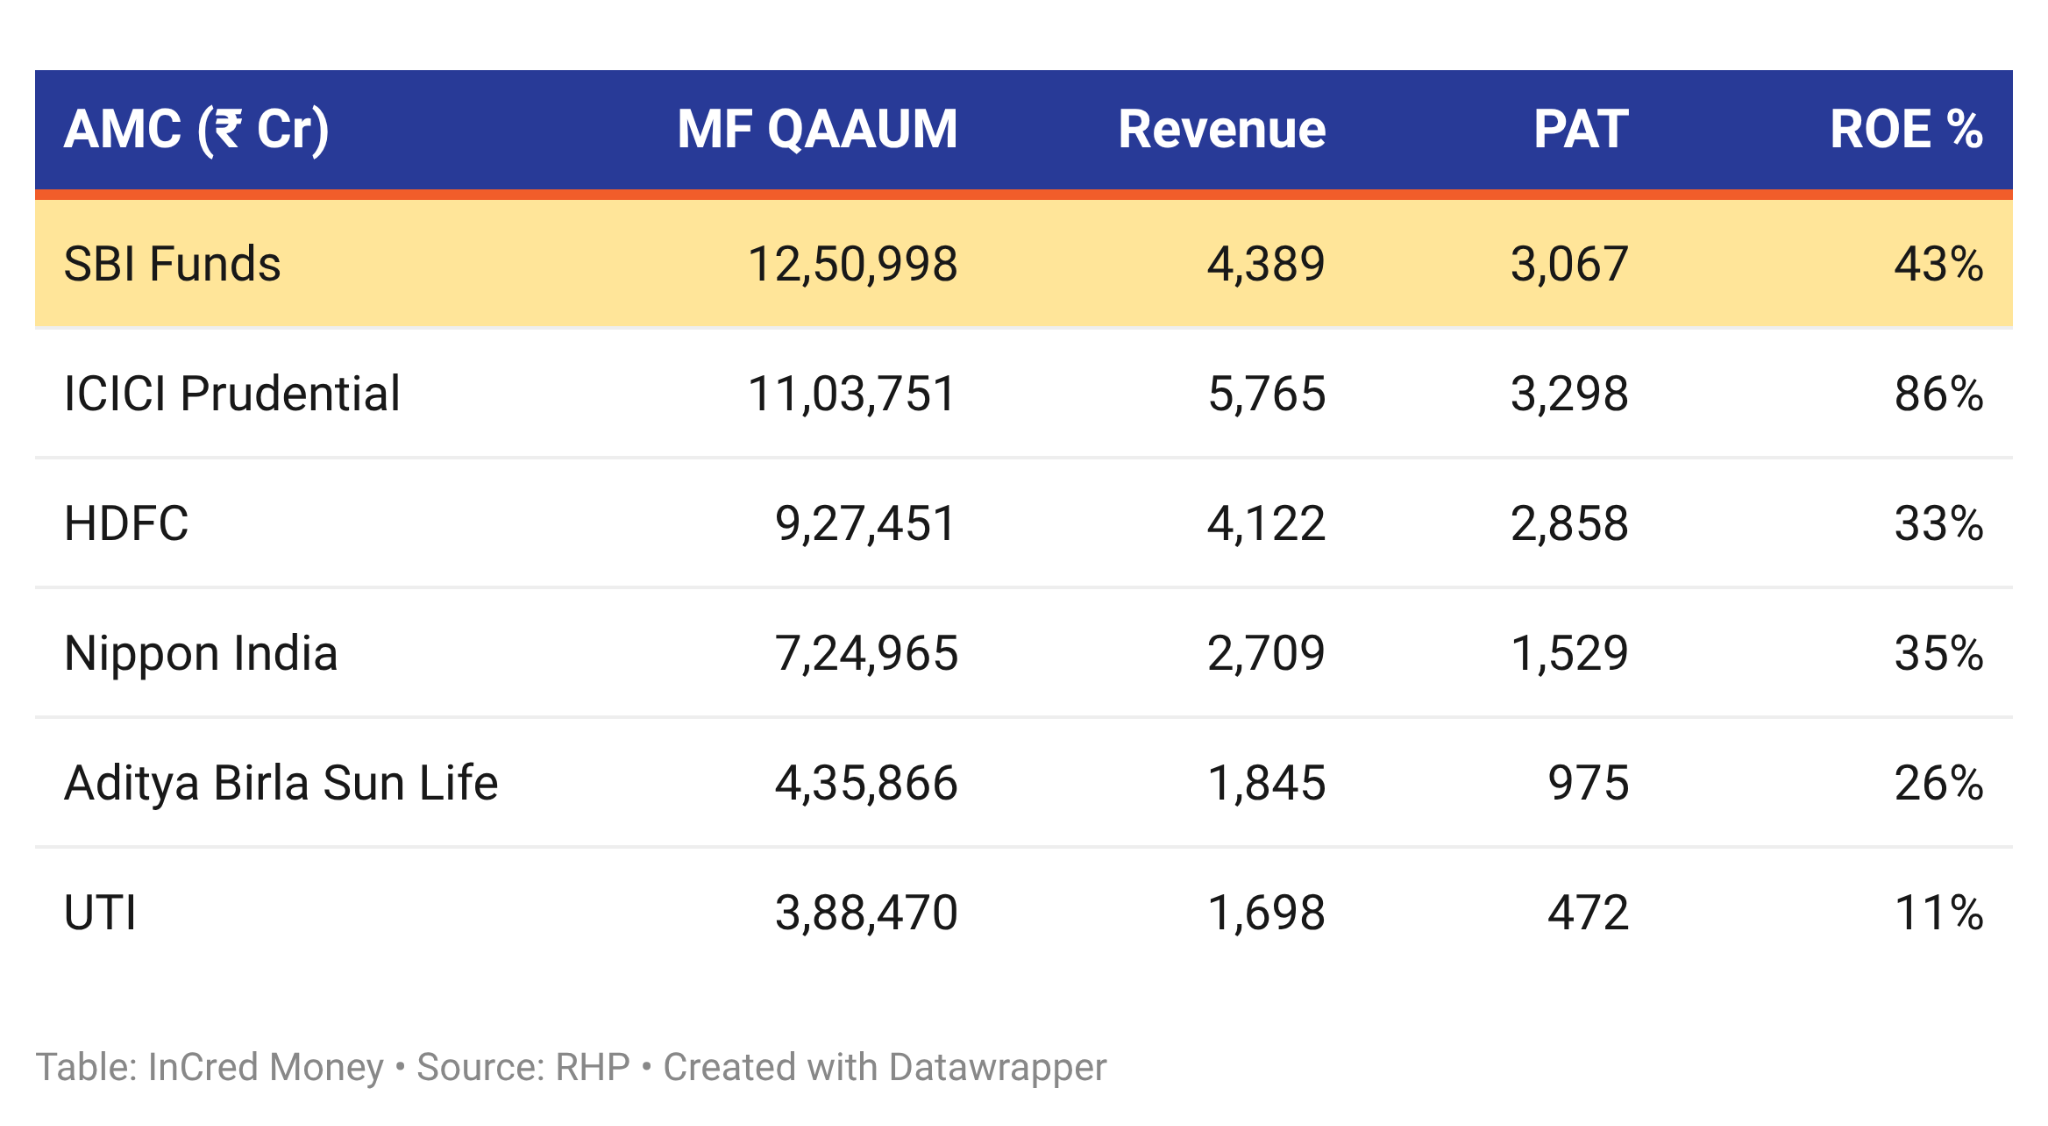
The table below compares the company with its five listed peers on parameters reported by all of them, for FY26.
The RHP compares the company with five listed peers based on FY26 financial metrics.
Its ROE of 43.02% in FY26 is the second highest in the set, behind ICICI Prudential AMC, and above HDFC AMC, Nippon India AMC, Aditya Birla Sun Life AMC and UTI AMC. On revenue and profit after tax, the company ranks second after ICICI Prudential AMC, despite carrying the largest asset base, reflecting its comparatively lower fee yield on QAAUM.
Key Risks
Revenue is tied to market-linked, AUM-based fees
Management fees made up 96.47% of the company’s revenue from operations in FY26, and this fee income is calculated as a percentage of AUM in each scheme. Any decline in AUM, whether from mark-to-market losses in a market downturn, higher redemptions, or a slowdown in fresh inflows, directly and proportionately reduces management fee income.A new SEBI fee framework will compress margins
SEBI’s Mutual Funds Regulations, 2026, effective April 1, 2026, introduce a Base Expense Ratio framework with fee caps 10 to 15 basis points lower than earlier limits across most scheme categories. The company has stated that, based on its AUM mix as of March 31, 2026, these changes are expected to reduce management fee income and put pressure on its weighted average revenue yield.
Summary
SBI Funds Management is the largest asset management company in India by mutual fund QAAUM, a position it has held since March 2021. Revenue and profit after tax have both grown, operating margin has widened, and return on equity of 43% in FY26. A meaningful share of its assets and revenue also remains concentrated in its top schemes, though this concentration has eased over the three years under review. The offer is entirely an offer for sale, so the company itself receives none of the proceeds.
Disclaimer
This content is based on publicly available information contained in the Red Herring Prospectus (RHP) and is intended solely for educational and informational purposes. It should not be construed as investment advice, recommendation or solicitation to invest.
Any video/image/text content is for educational and informational purposes only and does not constitute financial advice. Please do your own research or consult a qualified financial advisor before making any investment or trading decisions. Trading in stock markets involves the risk of loss.
Investments in the securities market are subject to market risks, read all the related documents carefully before investing. Brokerage will not exceed the SEBI prescribed limit.
InCred Money Broking Limited : NSE Member Code 09073, BSE Member Code 6329, MCX Member Code: 55215 , NCDEX Member Code : 1233 NSDL : IN-DP-474-2020 . SEBI Registration No. NZ000164738
Compliance Officer: NSE,BSE,MCX,NCDEX,NSDL : Mr RK Jain,011-40409999 support@stocko.in
Registered Office:- 3rd Floor, Building No.5, Local Shopping Complex, Rishabh Vihar, Near Karkarduma Metro Station. East Delhi – 110092
Source: Red Herring Prospectus (RHP) of SBI Funds Management Limited